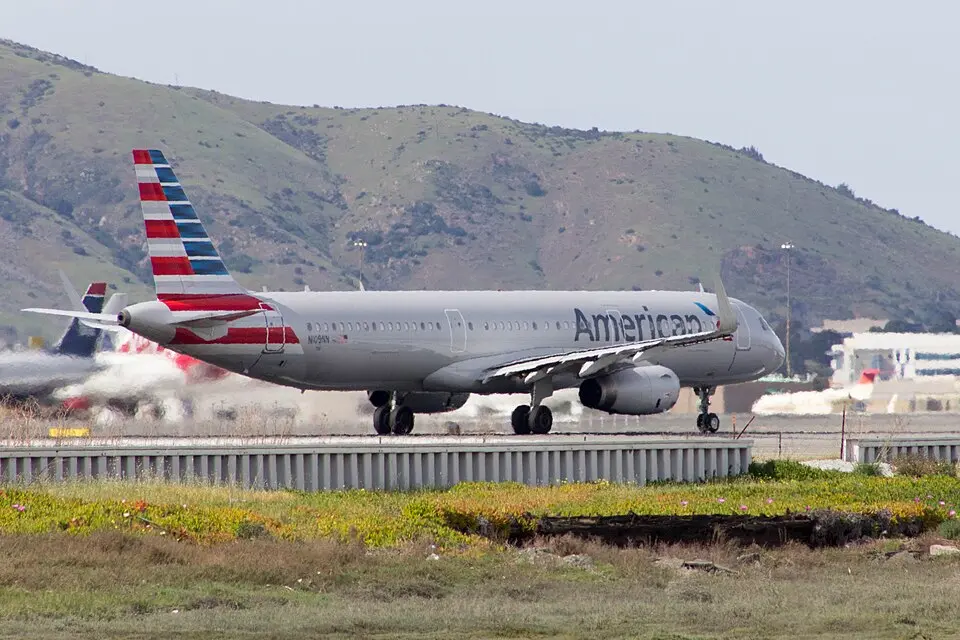
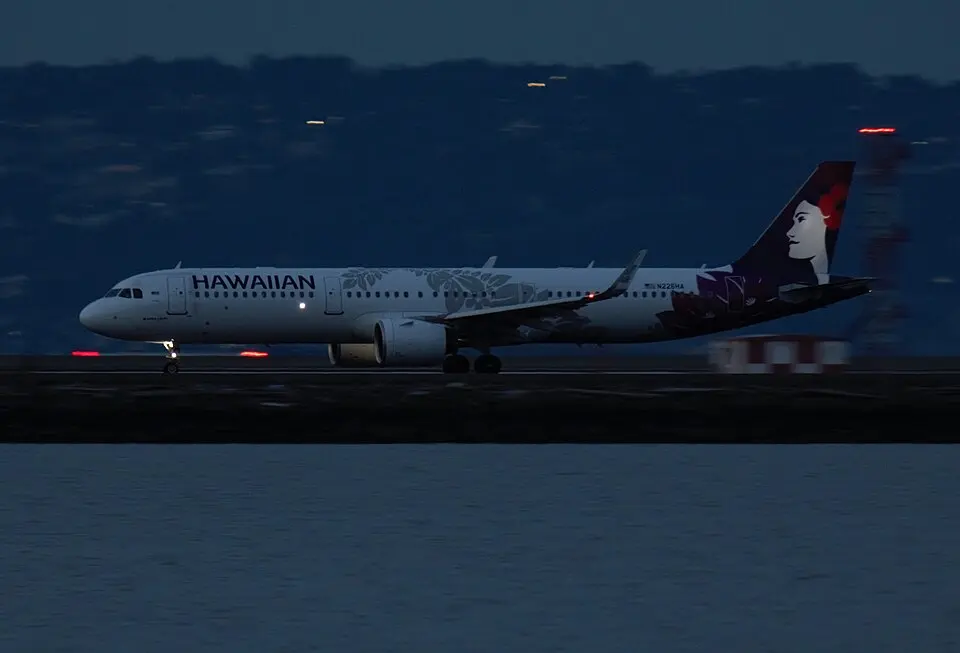
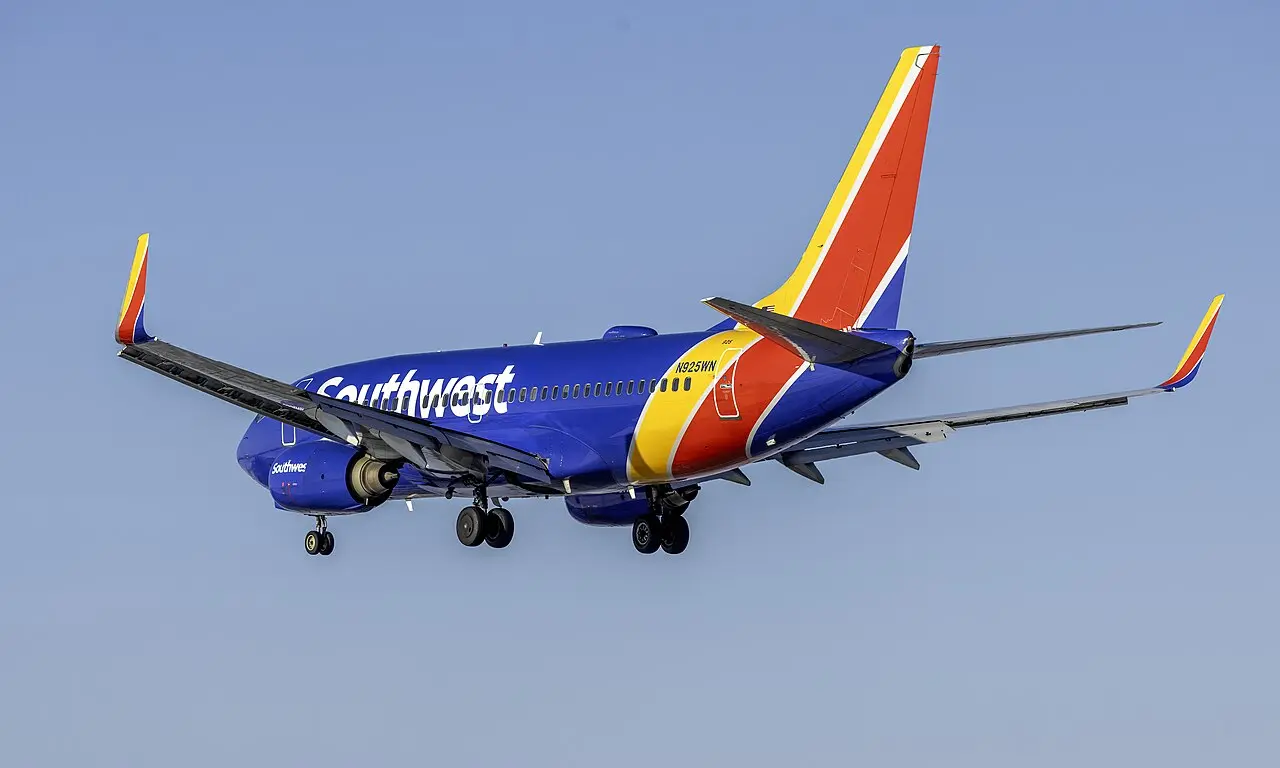
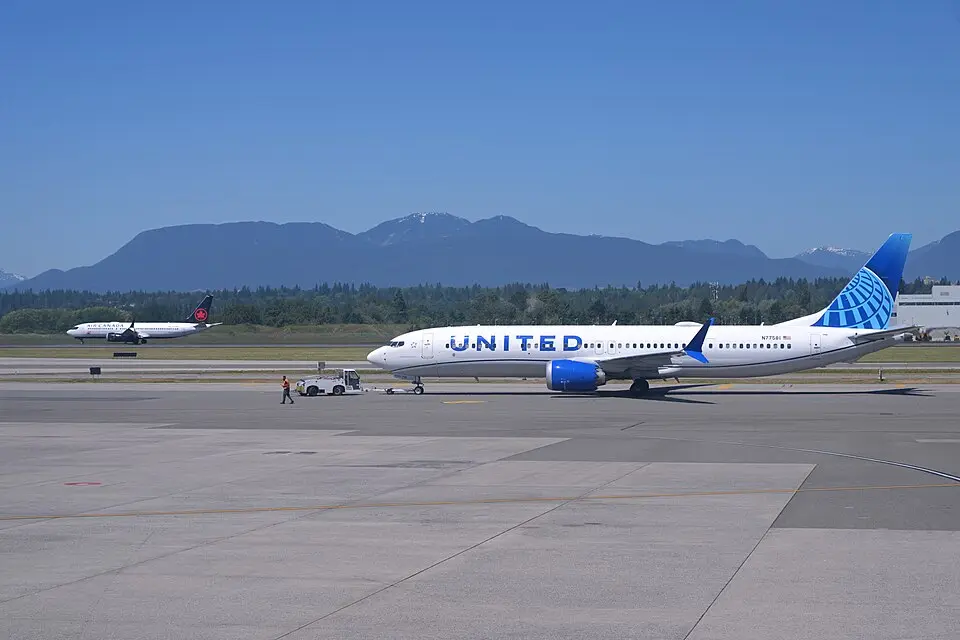
Airlines serving this route
Every carrier flying LAX ⇄ HNL nonstop, combining both directions, ranked by passenger share.


Aircraft flown on this route
Which airplane types operate LAX ⇄ HNL, based on official reporting across both directions.
Flight schedules
Live nonstop schedules in both directions. Switch tabs to see the return leg.
8 flights | Flight | Departs | Duration |
|---|---|---|
| AS 1888 | 7:39pm | 5h 54m |
| AS 825 | 8:15am | 5h 58m |
| AS 9925 | 12:45am | 6h 0m |
| AS 553 | 1:45pm | 5h 49m |
| AS 94 | 2:00pm | 6h 0m |
| AS 801 | 7:00am | 5h 58m |
| AS 803 | 10:00am | 5h 58m |
| AS 809 | 6:10pm | 5h 58m |
4 flights | Flight | Departs | Duration |
|---|---|---|
| DL 307 | 4:45pm | N/A |
| DL 443 | 6:30pm | 5h 42m |
| DL 465 | 1:55pm | 5h 43m |
| DL 480 | 8:45am | 5h 46m |
3 flights | Flight | Departs | Duration |
|---|---|---|
| AA 143 | 2:54pm | 5h 47m |
| AA 297 | 5:29pm | 5h 47m |
| AA 31 | 9:15am | 5h 50m |
3 flights | Flight | Departs | Duration |
|---|---|---|
| UA 1158 | 8:55am | 5h 46m |
| UA 1170 | 5:27pm | 5h 43m |
| UA 1431 | 1:15pm | 5h 56m |
1 flight | Flight | Departs | Duration |
|---|---|---|
| WN 1320 | 6:30pm | 5h 50m |
Seasonal traffic pattern
Combined passenger volume by month across both directions, showing which months run busiest.
Route Intelligence
Independent metrics on how stable, scarce, and competitive this route is, built from multi-year performance data back to 2022.
2026 Pace
Stable Competitive Year-Round Stable Competitive Year-Round Stable Competitive Year-Round Stable Minor Year-Round Watch Minor Year-Round  Hawaiian Airlines
  Atlas Air
  Philippine Airlines
  Qantas Airways
  Sun Country Airlines
  Contour Airlines
 Other top routes
More of the highest-volume nonstop routes in the country.
About the Los Angeles–Honolulu Route
A look at why LAX to HNL carries the traffic it does, who flies it, and what to expect onboard.
LAX to Honolulu is purely a vacation route, and the aircraft assigned to it reflect that: this is one of the few domestic routes in the country flown almost entirely with widebodies, mostly 777s and A330s, because the five-and-a-half-hour overwater flight requires extended operations certification and benefits from the extra fuel reserves and reliability of a larger aircraft. Hawaiian Airlines treats this as a flagship route alongside Delta, United, and Alaska, and competition keeps fares relatively rational for the distance covered. Demand stays remarkably balanced year-round rather than concentrating in summer the way many leisure routes do, since Hawaii functions as a winter escape for mainland travelers just as much as a summer destination.
How long is the flight from Los Angeles to Honolulu?
Nonstop flights from Los Angeles to Honolulu take approximately 5 hours 30 minutes. Because the route crosses open ocean, airlines are required to fly aircraft certified for extended operations (ETOPS), which is why widebodies dominate the schedule. The return leg from Honolulu to Los Angeles is slightly shorter at around 5 hours due to favorable tailwinds.
Gallery