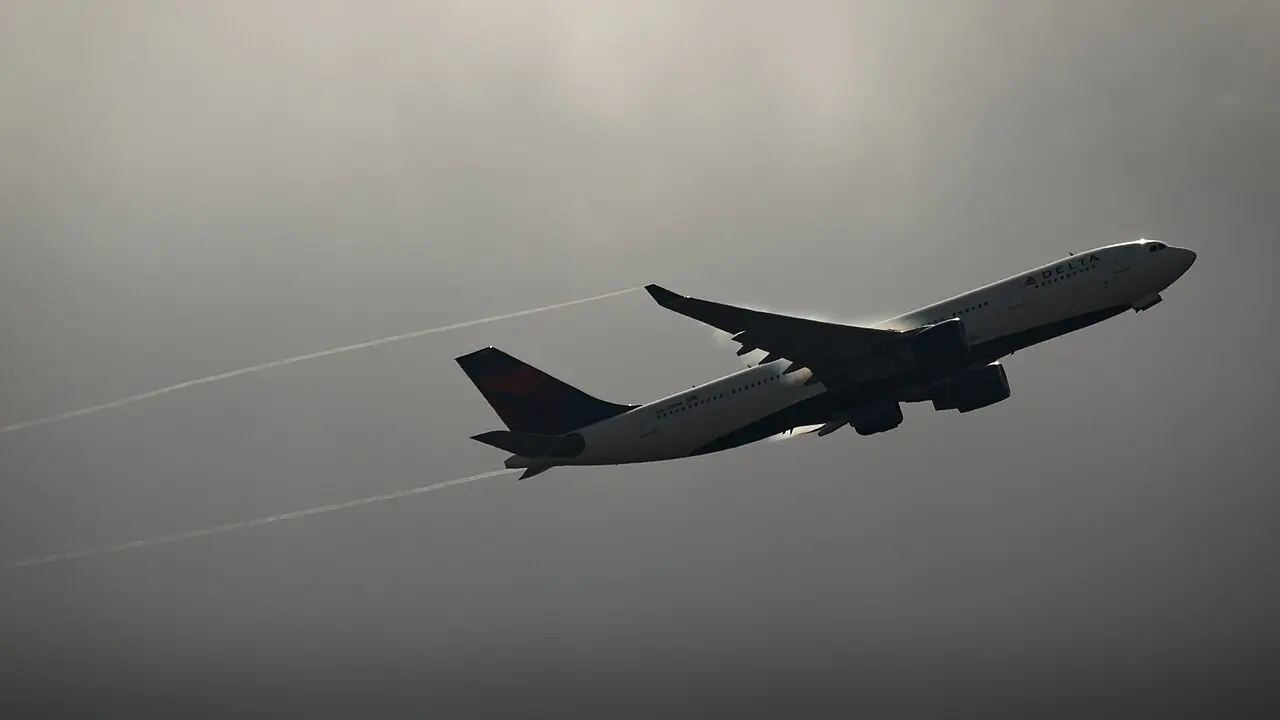
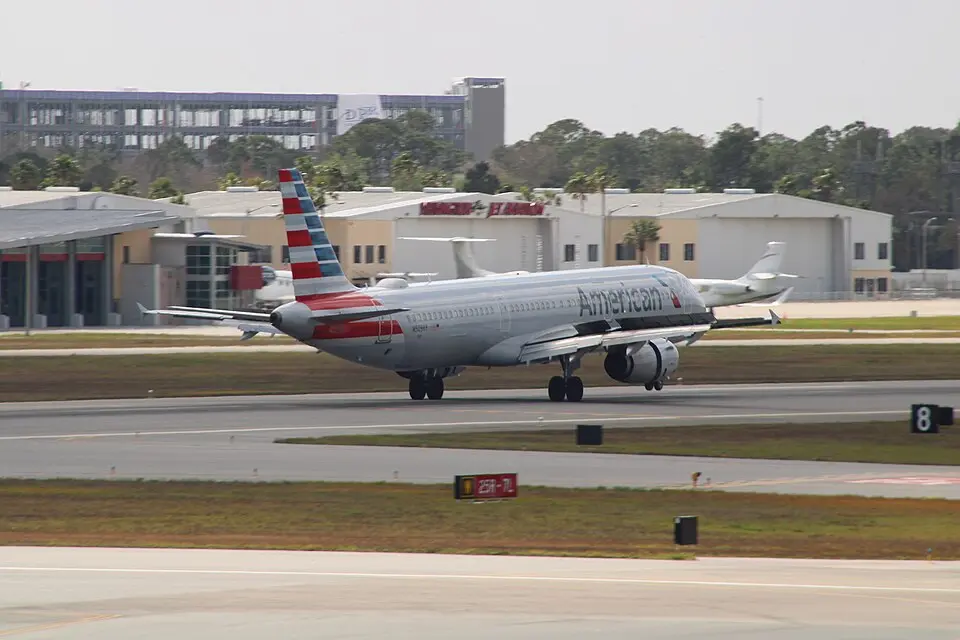
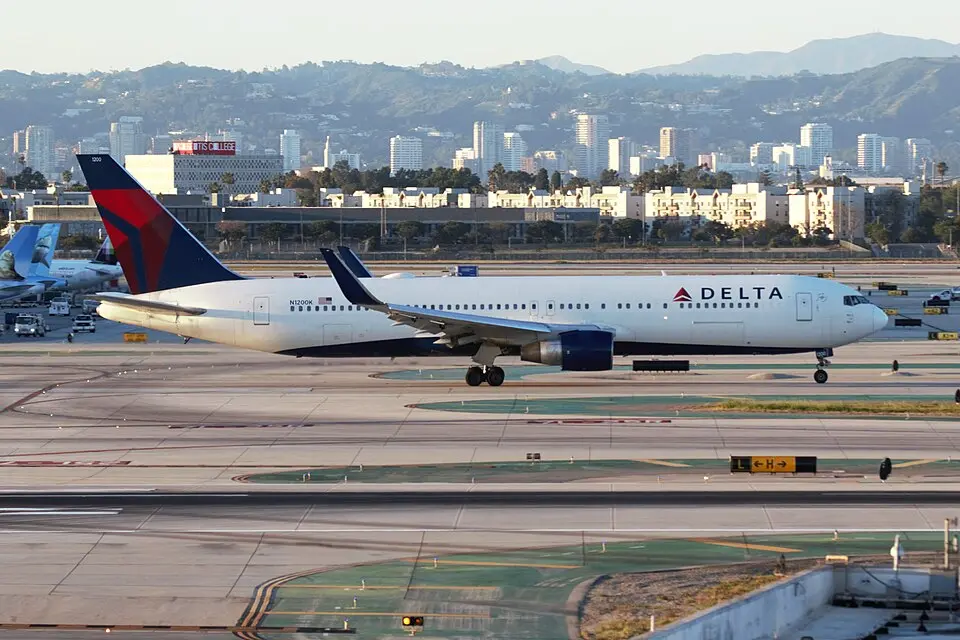
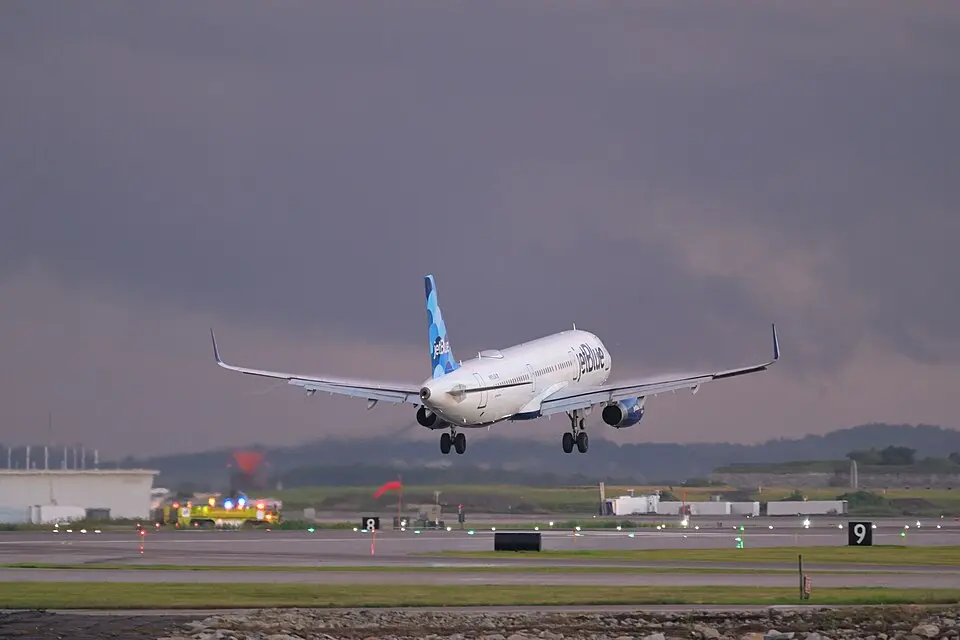
Airlines serving this route
Every carrier flying LAX ⇄ JFK nonstop, combining both directions, ranked by passenger share.


Aircraft flown on this route
Which airplane types operate LAX ⇄ JFK, based on official reporting across both directions.
Flight schedules
Live nonstop schedules in both directions. Switch tabs to see the return leg.
11 flights | Flight | Departs | Duration |
|---|---|---|
| B6 1024 | 10:40pm | 5h 29m |
| B6 1224 | 11:59pm | 5h 33m |
| B6 124 | 6:30am | 5h 26m |
| B6 224 | 11:15am | 5h 28m |
| B6 424 | 10:12am | 5h 30m |
| B6 524 | 8:00am | 5h 30m |
| B6 624 | 1:55pm | 5h 34m |
| B6 824 | 4:20pm | 5h 36m |
| B6 924 | 3:25pm | 5h 32m |
| B6 1524 | 8:40pm | 5h 29m |
| B6 324 | 12:18pm | 5h 31m |
13 flights | Flight | Departs | Duration |
|---|---|---|
| AA 9602 | 8:30am | 5h 34m |
| AA 9797 | 8:00am | 5h 34m |
| AA 168 | 4:00pm | 5h 26m |
| AA 274 | 12:01pm | 5h 29m |
| AA 30 | 10:29pm | 5h 31m |
| AA 4 | 1:25pm | 5h 35m |
| AA 10 | 9:28pm | 5h 30m |
| AA 118 | 6:05am | 5h 34m |
| AA 2 | 7:05am | 5h 34m |
| AA 238 | 10:00am | 5h 31m |
| AA 28 | 3:15pm | 5h 35m |
| AA 307 | 8:00am | 5h 34m |
| AA 32 | 11:00am | 5h 29m |
11 flights | Flight | Departs | Duration |
|---|---|---|
| DL 676 | 10:45pm | 5h 16m |
| DL 915 | 11:55pm | 5h 19m |
| DL 934 | 8:45am | 5h 35m |
| DL 938 | 7:35am | 5h 25m |
| DL 939 | 11:10am | 5h 42m |
| DL 951 | 9:45am | 5h 44m |
| DL 958 | 9:55am | 5h 39m |
| DL 960 | 9:00pm | 5h 21m |
| DL 972 | 11:15am | 5h 35m |
| DL 979 | 6:10am | 5h 20m |
| DL 991 | 1:10pm | 5h 38m |
Seasonal traffic pattern
Combined passenger volume by month across both directions, showing which months run busiest.
Route Intelligence
Independent metrics on how stable, scarce, and competitive this route is, built from multi-year performance data back to 2022.
2026 Pace
Stable Dominant Year-Round Stable Competitive Year-Round Stable Competitive Year-Round  Alaska Airlines
  United Airlines
  Turkish Airlines
  World Atlantic Airlines
  Qantas Airways
  Hawaiian Airlines


Other top routes
More of the highest-volume nonstop routes in the country.
About the Los Angeles–New York Route
A look at why LAX to JFK carries the traffic it does, who flies it, and what to expect onboard.
The LAX to JFK corridor is the original premium transcon, and airlines still treat it that way. American, Delta, JetBlue, and United all fly it with their best domestic hard product: lie-flat seats up front on multiple carriers, a rarity for a US domestic route. The five-and-a-half-hour flight time sits right at the edge of where airlines feel comfortable putting a premium cabin on a transcontinental route, and the entertainment-industry-to-finance-industry travel pattern keeps demand strong in both directions year-round rather than skewing toward one seasonal flow. Redeye flights eastbound and daytime flights westbound dominate the schedule, which tracks with how business travelers actually want to use the day on either end.
How long is the flight from Los Angeles to New York?
Nonstop flights from Los Angeles to New York JFK take approximately 5 hours 30 minutes. The return leg (JFK to LAX) is slightly shorter at around 5 hours due to favorable westbound tailwinds at cruise altitude.
Gallery